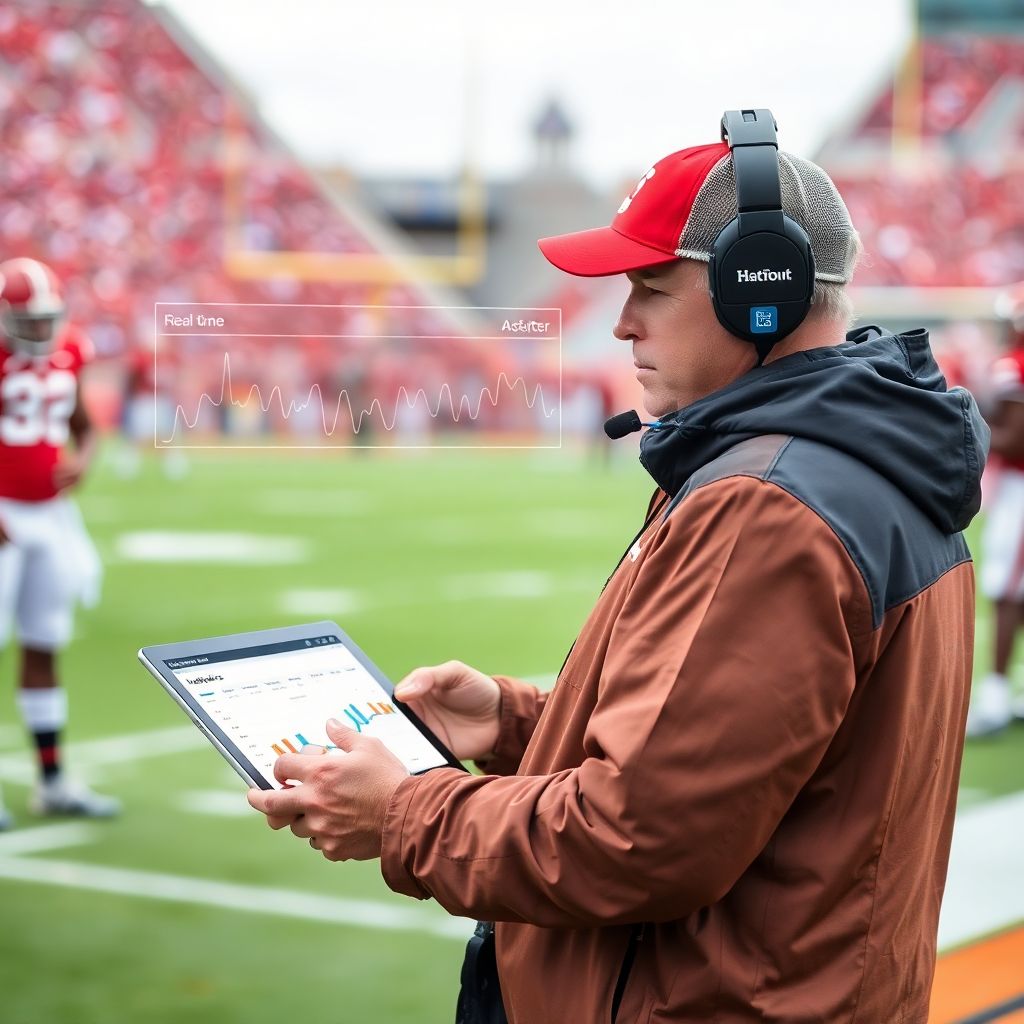
Analytics are changing fourth-down decisions by replacing gut feel with structured models that weigh field position, yards to go, score, clock and team strengths in real time. This guide shows how to build simple win‑probability and expected points rules, adapt them for college and the NFL, and integrate them safely into your sideline workflow.
Analytics-driven Playbook Summary
- Use a win‑probability mindset: you are optimizing game outcome, not just avoiding criticism on a single play.
- Base decisions on expected points added (EPA) and win‑probability impact, not raw conversion odds alone.
- Embed field position, yards to go, score and clock into a repeatable fourth‑down decision chart.
- Adjust model outputs for your offense, defense and risk tolerance instead of copying league‑average charts.
- Treat college and NFL decisions differently because of rules, hash marks, timing and kicking game strength.
- Deploy simple, pre‑computed fourth down decision making analytics tools rather than overloading staff with live calculations.
How Win-Probability Models Reframe Fourth-Down Choices
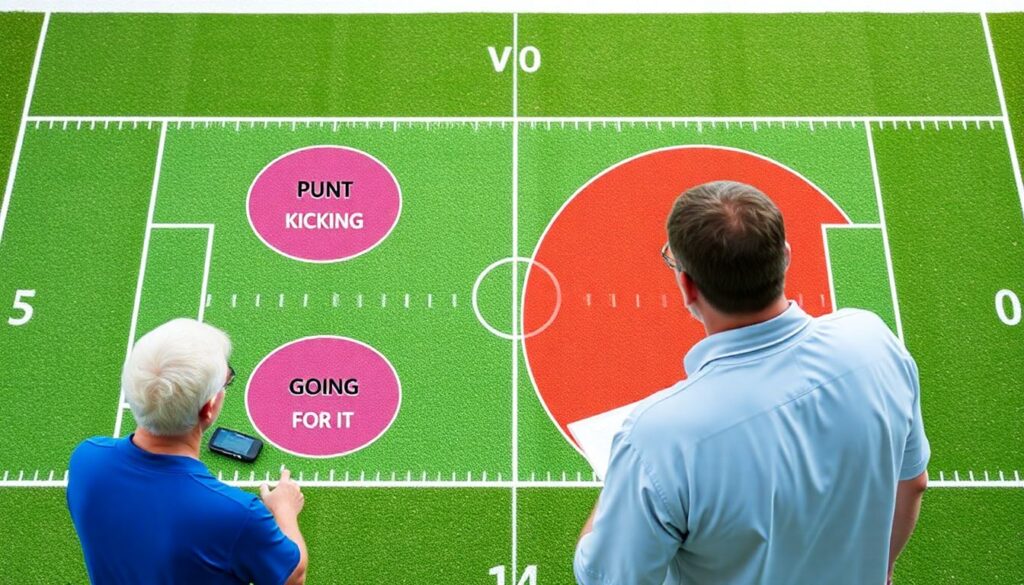
Win‑probability models estimate your chance of winning a game from any down, distance, field position, score and time combination. For fourth downs, they compare the win‑probability of three options: punt, field goal attempt and going for it.
This approach suits coaches who:
- Are comfortable following a pre‑defined chart even when it feels aggressive in high‑leverage moments.
- Have access to at least basic football data analytics software or an nfl advanced stats subscription to benchmark situations.
- Can dedicate one staffer (or an external consultant) to maintain and explain the model and charts.
You should not lean heavily on these models when:
- Your data is thin or unreliable (for example, small‑sample trick plays, new offensive system, radical tempo shifts).
- Weather, injuries or game conditions make historical baselines clearly misleading (extreme wind, backup long snapper, emergency quarterback).
- Your staff is not yet aligned, so following the chart will create sideline confusion or conflict in critical moments.
For many staffs, starting with high‑leverage scenarios-such as midfield, short yardage, or opponent red zone-provides visible benefits while keeping the chart simple enough to trust under pressure.
Expected Points Added (EPA) and Practical Decision Thresholds
Expected points (EP) is the average points a team can expect to score from a given down, distance and field position. Expected points added (EPA) is the change in EP caused by a play choice. For fourth downs, you compare the EPA of punting, kicking and going for it.
To get operational fourth‑down rules, you need a minimal but clear toolkit:
- Data or baseline charts – League‑level EP and win‑probability tables from reputable providers, often bundled with an nfl advanced stats subscription or via nfl analytics consulting services.
- Software to query situations – Spreadsheet, R/Python notebook, or commercial football data analytics software that lets you filter by down, distance, yard line and score differential.
- Simple model structure – Enough logic to:
- Estimate chance of conversion by yards to go and field position.
- Estimate post‑play EP or win‑probability if you convert or fail.
- Estimate EP or win‑probability if you punt or kick instead.
- Coaching‑friendly thresholds – Pre‑agreed “go” rules such as:
- Short yardage (up to about three yards) in plus territory is usually a candidate to go.
- Very long fourth downs in your own half are almost always punts.
- Borderline field‑goal range can be framed by your kicker’s realistic make distance.
- Printed or tablet‑based chart – Condense decisions into an easy matrix usable by the game‑management coach in seconds.
- Review loop – After each game, log fourth‑down decisions against the chart: when you followed it, when you over‑ruled it, and eventual outcome.
Field Position, Clock and Score: Multivariate Decision Rules
This section walks through a safe, step‑by‑step method to build and apply a practical fourth‑down decision engine.
- Define your decision zones on the field – Split the field into logical regions where the trade‑off between punting, kicking and going for it shifts meaningfully.
- Your territory deep (for example, inside your own 25‑yard line).
- Middle of the field (roughly your 25 to opponent 40).
- Field‑goal fringe (around opponent 40 to 30, depending on your kicker).
- Red zone (inside opponent 20).
- Bucket yards to go into simple bands – Avoid overfitting by collapsing distances.
- Short: one to three yards.
- Medium: four to six yards.
- Long: seven to ten yards.
- Very long: more than ten yards.
- Estimate EP and win‑probability for each option – For each zone and distance band, use your data source to compute or look up:
- EP and win‑probability if you punt (based on typical net punt from that spot).
- EP and win‑probability if you kick (using your kicker’s realistic range and make rate by distance band).
- EP and win‑probability if you go for it, combining:
- Estimated conversion rate at that distance.
- EP/win‑probability if you convert (new first down position).
- EP/win‑probability if you fail (opponent starting field position).
- Turn comparisons into clear go/punt/kick rules – For each zone and distance, mark the option with the highest win‑probability as your “base” decision.
- If going for it clearly dominates win‑probability, mark that cell as “GO”.
- If punt or field goal is clearly superior, mark accordingly.
- If differences are small, you can label the cell as “coach’s choice” and let context guide you.
- Layer in score and clock adjustments – Create simple overrides for end‑of‑half or end‑of‑game.
- When trailing late, favor “GO” cells more aggressively, especially in opponent territory.
- When leading and clock is an asset, you may lean slightly more conservative in your own half.
- Define specific time windows (for example, inside the last five minutes of each half) when these overrides apply.
- Build the sideline chart – Translate the model into a one‑page or one‑screen chart combining yard line and yards to go.
- Rows: yard line (grouped into ranges).
- Columns: yards‑to‑go bands.
- Cells: “PUNT”, “FG”, or “GO”, optionally with a note like “high leverage” to signal game‑changing decisions.
- Assign responsibility and communication flow – Decide who reads the chart and who tells the head coach.
- One coach (analytics or game‑management) should track down, distance and yard line and call out the recommendation immediately after third down.
- Head coach retains final say, but must know the recommendation quickly enough to keep tempo.
Fast-Track Mode Checklist
When you do not have time to build a full model, use this quick, conservative algorithm:
- In your own half and more than medium distance, default to punt unless late and trailing.
- In the middle of the field with short yardage, lean toward going for it unless your defense is dominating.
- In field‑goal fringe, prefer going for it on short yardage and field goal on long yardage, using your kicker’s comfort range.
- In the red zone on short yardage, favor going for it unless three points meaningfully change the game (for example, taking the lead).
- Inside two minutes, relax conservatism when trailing: if a conversion meaningfully extends your scoring chance, go for it.
Illustrative Fourth-Down Decision Table by Field Position
The table below illustrates how a staff might contrast the relative attractiveness of punting, kicking or going for it without publishing exact percentages. Adapt the yard lines and bands to your roster and league.
| Field Zone / Yards to Go | Punt Option | Field Goal Option | Go For It Option | Qualitative Win‑Probability Outlook |
|---|---|---|---|---|
| Own 10-25, Long (7-10+) | Strong default choice | Rarely attempted | Emergency only | Punt preserves win‑probability; aggression usually hurts. |
| Own 35-50, Short (1-3) | Viable but passive | Too long for most kickers | Preferred in neutral game states | Going for it often has higher win‑probability, especially when not leading comfortably. |
| Opp 45-35, Medium (4-6) | Field‑position play | Borderline distance | Context‑dependent | Differences between options are small; chart and risk appetite drive the choice. |
| Opp 35-25, Short (1-3) | Usually sub‑optimal | Solid option | Often best option | Going for it can significantly increase scoring odds; field goal is safe but lower ceiling. |
| Red zone (Opp 20-10), Any Short | Very rare | Bankable points | Aggressive scoring play | Trade‑off between locking in points and maximizing touchdowns; both can be chart‑favored depending on score. |
Adjusting for Team Strength and Risk Appetite
Once the baseline chart is built, adjust it for your personnel and philosophy using this review checklist:
- Offensive line power: If short‑yardage run success is consistently strong, expand your “GO” cells in short yardage, especially in the middle of the field and in plus territory.
- Quarterback and skill talent: With a reliable passing game, consider going for it more often in medium distances where passes are your strength.
- Defensive quality: With a dominant defense, conservative choices (punts) lose less win‑probability, so you can narrow the “GO” region in your own half.
- Special teams confidence: If your punter consistently flips the field or your kicker is comfortable from longer range, adjust the chart to reflect these advantages.
- Injury status: When key offensive players are limited, temporarily shift borderline “GO” cells toward punt or field goal.
- Risk appetite definition: Agree in advance whether your staff prefers a slightly aggressive, neutral or conservative posture, and codify it with notes on the chart.
- Scenario‑specific overrides: Create explicit notes for rivalry games, playoffs or weather‑affected games where you choose to deviate systematically from regular‑season norms.
- Post‑game audit: After each game, log every deviation from the chart and decide whether it reflects a one‑off context or signals a needed chart update.
Comparing College and NFL: Rule Differences and Model Calibrations
College and NFL fourth‑down analytics share structure but require different calibrations. Common pitfalls include:
- Ignoring hash mark width: College hashes create sharper angle and distance differences for kicks, shifting several fringe “FG” cells into “GO”.
- Copying NFL fourth‑down charts directly into college playbooks, without adjusting for different kicking accuracy, tempo and explosive play frequency.
- Overlooking clock rules: The timing mechanics differ on first downs and boundary plays, so late‑game clock‑based overrides need separate college and NFL versions.
- Assuming similar opponent quality: In mismatches common in college, analytics may support more conservative decisions when you are heavily favored.
- Underestimating special teams variance: Block and return rates in college can make long field goals and short punts more volatile than NFL baselines suggest.
- Not leveraging sports analytics companies for college football that already model NCAA‑specific EP and win‑probability instead of building from pro data.
- Failing to align with officiating tendencies and replay rules, which can slightly change risk‑reward for marginal spot plays and deep shots on “GO” calls.
Deploying Real-Time Tools: Dashboards, Communication, and Workflow
Different organizations will operationalize analytics in distinct ways. Here are realistic deployment options and when they fit.
- Pre‑printed charts only – Best for high‑school, small college or resource‑limited staffs. Build a robust off‑season chart and rehearse its use. Minimal tech risk; relies on the game‑management coach to track ball position and down.
- Tablet dashboard with live context – Use football data analytics software or custom dashboards that highlight the recommended action once you input down, distance and yard line. Works for college and NFL teams with staffed analytics roles.
- Dedicated analytics advisor with headset access – Common in pro environments or top programs engaging nfl analytics consulting services. An analyst monitors situations, uses fourth down decision making analytics tools, and communicates succinct recommendations to the sideline.
- External subscription plus simple in‑house wrapper – Programs can combine an nfl advanced stats subscription or similar service with a lightweight in‑house interface to customize rules, ensuring long‑term flexibility without building everything from scratch.
Coaches’ Operational Concerns
How do I introduce a fourth-down chart without losing the locker room?
Start by sharing the logic and historical examples during off‑season installs, then pilot the chart in scrimmages. Emphasize that the head coach still decides, but now with better information, and review both analytics‑backed wins and losses honestly in film sessions.
What if the chart says to go for it but my offensive coordinator hates the call?
Clarify chain of command: head coach owns fourth‑down decisions, coordinators own play calls. Encourage your staff to prepare a small menu of favorite “GO” plays for each situation so coordinators feel ready rather than trapped.
How can I keep the process fast enough with play clock pressure?
Assign one coach to track ball position and down immediately after third down and to call out the chart recommendation. Keep the chart visually simple, and practice the communication sequence in team periods the same way you rehearse two‑minute drill.
Do I need custom software, or can I manage with spreadsheets and paper?
Many programs succeed with a spreadsheet‑generated chart printed each week. Custom tools and integrated dashboards help, but the biggest gains come from a clear, rehearsed process, not from extra technology layers.
How often should I update my fourth-down model?
Review at least once per off‑season for structural changes and after every few games for small tweaks. Significant scheme changes, a new quarterback or major special teams shifts are good triggers for a deeper recalibration.
What if media or fans criticize aggressive fourth-down calls?
Prepare to explain your philosophy in plain language: you are making decisions that maximize the team’s chance to win over a season, not just avoiding blame in one moment. Consistent messaging and transparency usually reduce noise over time.
Can analytics account for momentum or emotional swings?
Models capture field position, score, time and historical performance, not emotions. Use momentum as a tiebreaker in near‑even situations, but avoid letting short‑term feelings override large, model‑backed win‑probability advantages.