From static film to live data streams
Why “watching tape” isn’t enough anymore
For decades, game prep meant dim rooms, clickers, and coaches grinding through film frame by frame. That hasn’t disappeared, but it’s now wrapped inside full-blown american football analytics software that tags every snap with context: personnel, coverage, front, motion, result. Instead of “that safety bites on play‑action a lot,” you get quantified tendencies over hundreds of plays, filtered in seconds and visualized as heatmaps, route trees, or pressure zones on a screen.
[Diagram: a timeline of a single play where manual film tags (formation, motion, coverage) feed into a central datastore; from there arrows branch to dashboards for coaches, cut‑ups for players, and models for analysts.]
—
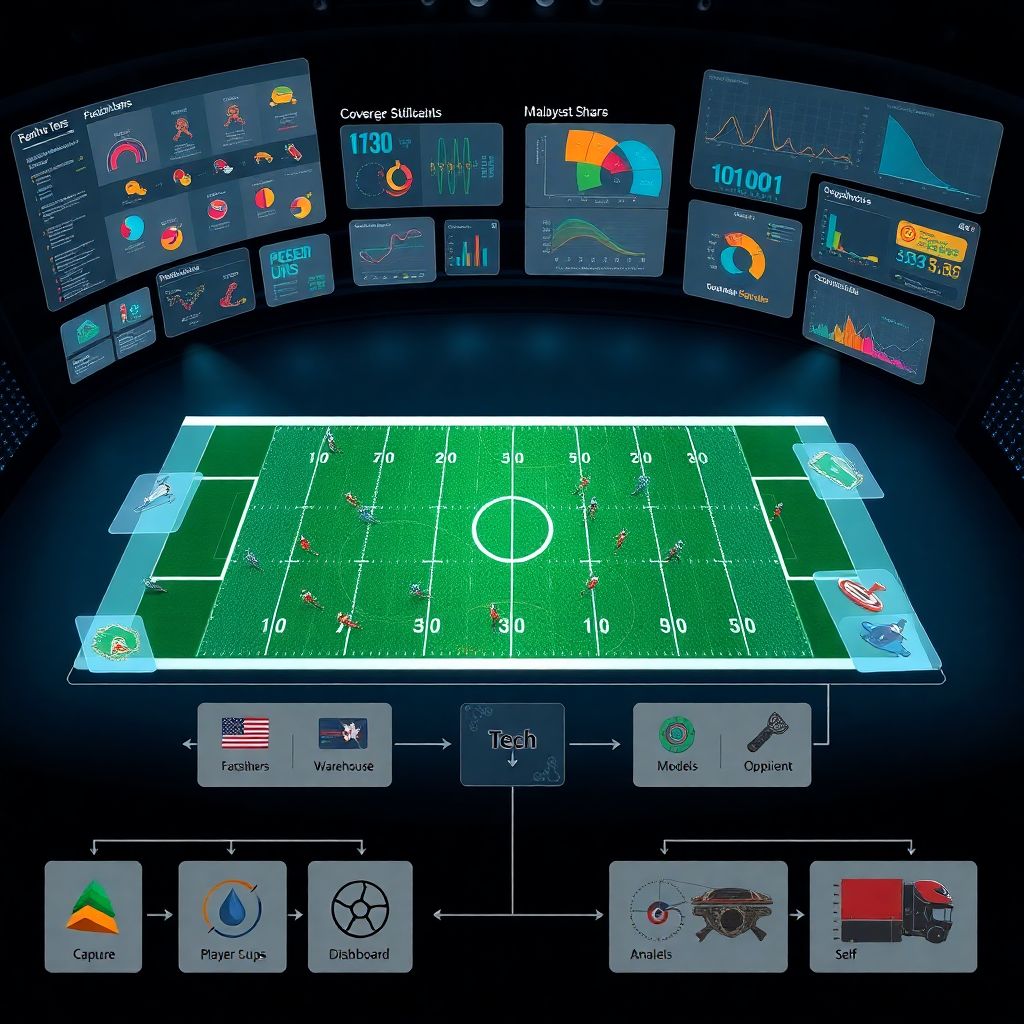
Tech stack behind modern football analytics
From film room to data pipeline
Today, raw video from practice and games is ingested into football game film analysis tools that auto-detect player locations, track speed, and align frames with tracking chips in pads or helmets. A typical pipeline: capture → auto-tag → human QA → data warehouse. Once the data lands, analysts query it using SQL or Python notebooks, building situational profiles like “3rd-and-medium vs 2-high shells” in minutes, not days.
[Diagram: boxes labeled Capture → Tracking → Tagging → Warehouse → Dashboards, linked in a linear flow, with side arrows to “Models” and “Scouting reports.”]
Platforms vs spreadsheets
Early adopters hacked everything together with Excel and homegrown scripts. Now an american football performance analytics platform bundles:
– Centralized storage for tracking, play-by-play, and video
– Built-in visualization (route density maps, pressure lanes, coverage shells)
– APIs to push insights to tablets and VR practice tools
Spreadsheets still exist, but the heavy lifting has shifted to systems that support live updates and near real-time decision-making on game day.
—
How analytics actually change the game plan
Offense: scripting with probabilities, not vibes
Offensive coordinators used to lean on gut feel and a few hand‑tallied charts. With sports data analytics services for football teams, they now see exact efficiency curves: EPA per play by down, distance, hash, motion type, and defensive shell. The opening script is built to force defenses into their weakest coverage structures, then stacked with “answers” if the defense overcorrects. It’s less “my favorite plays” and more “your least stable tendencies under stress.”
Defense: calling to break offensive rules
On defense, analytics reshape how calls are bundled. Instead of just “call pressure on 3rd-and-long,” models flag specific route concepts an offense leans on from certain bunch looks or condensed splits. Analysts surface:
– Which motions truly change the play vs which are window dressing
– How QB processing time spikes vs simulated pressures
– Where run fits break down when fronts are shifted late
Defensive play sheets now often include quick-glance probability grids, showing the most likely concepts after each offensive motion or shift.
—
In-game adjustments in the 2026 era
Sideline tablets as decision hubs
By 2026, sideline tech is more than replay. Teams integrate american football analytics software directly into tablets, with precomputed “if‑then” trees. When the opponent shows an unexpected wrinkle, staffers log tags live; the platform recomputes key rates—like success vs empty or pistol—during TV timeouts. Instead of guessing, coordinators see updated odds for pressure, run-pass rates, and shot plays on specific downs.
Fourth-down and 2-point decisions
The “go for it” revolution keeps accelerating. Models trained on millions of historical snaps plus tracking data provide real-time recommendations. These tools output not only go/field goal/punt options, but also:
– Optimal run/pass mix given current OL health and defensive fatigue
– Preferred concept families based on how DBs are handling motion
– Risk ranges accounting for weather, kicker range, and backup QB scenarios
Coaches still own the decision, but sports analytics consulting for football coaches helps them interpret model confidence, edge size, and when to override based on locker-room realities.
—
Player development and load management
Micro-tendencies, macro impact
On the player side, film is now a mirror with hard numbers. Cornerbacks review every rep with overlays showing cushion depth, hip turn timing, and closing speed. Linebackers see run-fit heatmaps highlighting gaps they’re late to fill. Through specialized american football performance analytics platform modules, coaches deliver position-specific dashboards instead of generic grade sheets, nudging very precise behavioral tweaks across hundreds of practice reps.
Injury risk and workload
Tracking plus biomechanical modeling underpins modern load management. Analysts watch spikes in high‑speed yardage, deceleration loads, and awkward angles logged in practice. When thresholds trip, players get graded “yellow” even if they feel fine. That status can silently reshape the plan: fewer special‑teams reps, altered blitz packages, or more rotation series. The goal is simple: preserve peak availability for playoff-relevant games without tipping opponents about underlying issues.
—
Scouting, self-scout, and opponent modeling
Self-scout as a weekly feedback loop

Self-scout used to be an off-season project; now it’s a weekly sprint. Football game film analysis tools map your own tendencies exactly like an opponent’s. If your defense is 80% quarters vs trips in the red zone, your next rival will know it—unless you proactively break that bias. The analytics staff flags the most predictable calls, prompting intentional “tendency breakers” scripted into high‑leverage situations.
Opponent scouting with predictive layers
Old scouting reports were long PDFs full of text. In 2026, sports data analytics services for football teams deliver interactive models: click a formation, pick a motion, and see likely plays ranked by probability. For QBs, that becomes mental rep fuel—learning not just coverage IDs, but the conditional probabilities of pressure, simulated blitzes, or late-rotating safeties after certain protections or alignments.
[Diagram: two mirrored nodes labeled “Self” and “Opponent,” each connected to sub-nodes “Formations,” “Motions,” “Tendencies,” with arrows crisscrossing to indicate shared modeling logic.]
—
Comparing football analytics to other sports
Why football is uniquely complex
Compared to baseball or basketball, american football analytics faces nastier constraints. Sample sizes per situation are tiny, personnel groupings constantly change, and playbooks mutate week to week. Where baseball can lean heavily on stable one‑on‑one events, football must model 22 moving parts plus coaching intent. That’s why american football analytics software leans on probabilistic modeling, simulation, and heavy contextual tagging rather than just raw box-score data.
Borrowing and adapting methods
Despite the complexity, many methods originate in other sports:
– Expected points and win probability curves inspired by baseball’s run expectancy
– Player tracking clustering adapted from basketball’s off-ball movement analysis
– Workload and injury modeling repurposed from soccer GPS and heart-rate datasets
The twist is that American football needs fatter error bars and more scenario-specific tuning, because coaching creativity can distort patterns faster than in more static sports.
—
Human element, ethics, and future trends
Coaches and players still drive the story
Even with advanced platforms and sports analytics consulting for football coaches, models don’t feel wind, hear the crowd, or sense a rookie corner’s panic. In the best rooms, analytics is a conversation partner, not a dictator. Analysts translate probabilities into language coaches and players trust, while coaches feed back context the data can’t see—scheme installs, locker-room dynamics, or a QB’s comfort level with certain reads under pressure.
What’s coming next
Looking ahead from 2026, three trends stand out. First, richer multi-angle video plus on‑body sensors will fuse into true 3D “play twins” for simulation in VR. Second, on-the-fly modeling will move closer to the field, trimming latency between live events and updated dashboards. Third, privacy and competitive integrity debates will sharpen as biometric and cognitive data enter the mix, challenging leagues to define what’s fair game for competitive american football analytics software and what must stay strictly off-limits.