
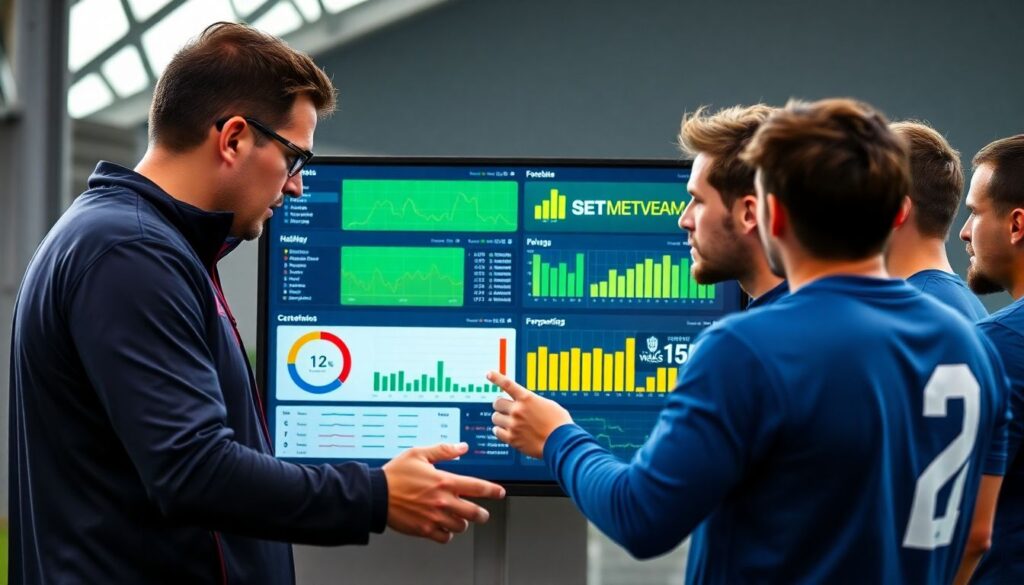
Advanced team stats translate raw events into context: chance quality, pace, impact, and efficiency adjusted for opponents and usage. Used correctly, they separate real skill from noise, highlight sustainable strengths, and flag fragile hot streaks. The goal is not more numbers, but clearer decisions about lineups, tactics, and recruitment.
Core Conclusions: Which Advanced Stats Actually Explain Performance
- Shot-quality models such as expected goals (xG) and expected points expose how often your tactics create genuinely dangerous chances, not just shot volume.
- Pace and possession-adjusted metrics let you compare teams fairly, even when styles and league tempos are very different.
- Impact metrics like RAPM, WAR, and BPM estimate how much a player changes team performance after controlling for teammates and opponents.
- Lineup and on/off analysis reveals which player combinations actually drive runs of good or bad play, beyond individual box-score stats.
- Rate and efficiency indicators (e.g., TS%, PER-style indexes) are useful screens, but they can over-reward high-usage scorers and under-value defense.
- Noise and regression to the mean are unavoidable; without enough possessions or games, even the smartest metric will mislead you.
Expected Goals (xG) and Shot-Quality Models: Definition, Calculation, Use Cases
Expected goals (xG) estimate the probability that a given shot becomes a goal based on historical data from similar shots. Inputs typically include shot location, angle, body part, type of assist, pressure, and game state. Team xG is the sum of those probabilities across all shots taken or conceded.
As a simple illustration, if a team takes three shots worth 0.1, 0.2, and 0.4 xG, its total xG is 0.7. Scoring twice from those shots means it outperformed expectation in that match, but over many games you expect goals to broadly track xG, not individual match totals.
In practice, coaches use xG and related shot-quality models to evaluate attacking schemes, set-piece routines, and defensive structure. A soccer team performance analysis software with advanced metrics will often break xG down by pattern of play, so you can see whether you are truly improving chance quality or just shooting more.
| Metric / Concept | Core Formula or Idea | Main Data Inputs | Primary Strengths | Main Weaknesses |
|---|---|---|---|---|
| Expected Goals (xG) | Sum of goal probabilities for each shot based on similar historical shots. | Location, angle, body part, assist type, pressure, shot type. | Separates shot quality from quantity, good for tactical evaluation. | Model-specific, can mis-value rare shot types or poor tracking data. |
| Pace / Possession-Adjusted Ratings | Points or goals per possession or per standardized number of plays. | Possessions, plays, shots, scoring events, turnovers. | Enables fair comparison across styles and leagues. | Depends on accurate possession estimates; can hide style-specific edges. |
| RAPM / WAR / BPM | Estimate player impact on team scoring margin vs. average. | Play-by-play outcomes, lineups, minutes, box-score stats. | Context-adjusted view of player value, beyond basic stats. | Model assumptions, noisy for low minutes or role changes. |
| Lineup On/Off | Team performance with player or lineup on court/field vs. off. | Lineup combinations, scoring margin, time on court/field. | Captures synergy and fit of specific combinations. | Highly sensitive to sample size and rotation patterns. |
| TS% / PER-style Indexes | Efficiency per scoring attempt or composite box-score rating. | Points, shot attempts, free throws, rebounds, assists, turnovers. | Quick comparison of scoring efficiency and box-score impact. | Can overrate volume scorers, weak on defense and off-ball value. |
| Sample-Size & Regression Checks | Compare current rates to long-term baseline and league norms. | Attempt counts, games, historical performance, league averages. | Separates stable signal from short-term streaks. | Requires patience; early-season numbers remain uncertain. |
- Actionable takeaway: use xG trend lines (for and against) to judge whether your tactical changes are truly improving chance quality.
- Diagnostic threshold: sustained xG against that is clearly worse than league-average over a long stretch usually demands structural defensive changes.
Pace and Possession-Adjusted Metrics: Normalizing Volume Across Teams
Pace and possession-adjusted metrics normalize performance by how many plays, possessions, or drives a team has. Without this adjustment, high-tempo teams look better simply because they create more actions, not because each action is more efficient or effective.
- Estimate possessions or plays (for example, combining field attempts, turnovers, and rebounds in basketball, or drives in football and baseball plate appearances).
- Calculate output per possession: points, goals, expected points, or expected goals per possession rather than per game.
- Adjust for opponent quality where possible to avoid overrating performances against weaker defenses.
- Compare your per-possession numbers across seasons, leagues, or styles to guide tactical choices.
- Use possession-based splits (half, quarter, period) to spot fatigue or rotation issues more quickly.
- With a sports analytics platform for team performance metrics, automate these possession-based views for every lineup and game state.
- Actionable takeaway: always evaluate both offense and defense on a per-possession basis before making stylistic changes.
- Diagnostic threshold: if your team scores well per game but poorly per possession, the current pace may be disguising deeper efficiency problems.
Player Impact Measures: RAPM, WAR, BPM – What They Capture and Miss
Impact metrics such as Regularized Adjusted Plus-Minus (RAPM), Wins Above Replacement (WAR), and Box Plus-Minus (BPM) estimate how much a player changes team performance relative to an average or replacement-level player. They attempt to control for teammates, opponents, and usage context.
RAPM uses possession-level or play-by-play data and regression techniques to separate overlapping effects of different players on the court or field. WAR converts that impact into wins above a hypothetical easily available player. BPM and similar box-score models approximate impact using only box stats when play-by-play is limited.
- Roster construction: compare players with similar box stats but different impact scores to identify under-valued role players.
- Rotation planning: for the best basketball advanced statistics tools for coaches, impact metrics help decide which bench units can survive without star players.
- Contract and transfer decisions: when you buy access to advanced baseball team stats database resources, WAR-style numbers provide a common value language across positions.
- Development focus: low box-score volume but strong impact suggests screens, spacing, or defensive positioning as hidden strengths to reinforce.
- Scouting and recruitment: combine RAPM/WAR/BPM with video to verify whether the model is rewarding skills that fit your tactical vision.
- Actionable takeaway: treat high impact scores as a cue to watch more film, not as proof on their own.
- Diagnostic threshold: be cautious trusting any impact estimate based on limited minutes, role changes, or unusual lineups, because the model will be unstable.
Lineup and On/Off Analysis: Measuring Synergy and Contextual Impact
Lineup and on/off metrics compare how the team performs when a specific player or combination is on the court or field versus when they are off. They help you understand synergy, fit, and the true cost of certain rotations beyond individual stat lines.
An on/off number might measure scoring margin per possession with a player on versus off. For example, if your small-ball lineup consistently improves ball movement and shooting quality but concedes size, on/off data will show whether the trade-off is still positive overall against different opponent types.
- Advantages:
- Highlights which combinations amplify or cancel out each other's strengths.
- Shows whether stars are propping up weak benches or benefiting from strong support units.
- Helps test tactical experiments quickly by tracking specific rotation packages.
- Pairs well with advanced football team stats analysis software that tags personnel groupings on each play.
- Limitations:
- Highly sensitive to opponent quality, game script, and sample size.
- Bench-heavy units often face opponent benches, making raw comparisons tricky.
- Coaches may shelter certain lineups, biasing the results toward favorable contexts.
- On/off ignores individual matchup difficulty unless combined with other tracking data.
- Actionable takeaway: use lineup on/off data to generate rotation questions, then confirm with video and tactical goals.
- Diagnostic threshold: avoid overreacting to any lineup result based on a small stretch of minutes or a limited set of game situations.
Rate and Efficiency Indicators: True Shooting, PER, TS%, and Their Limitations
Rate and efficiency metrics compress production into per-minute or per-possession numbers. True Shooting Percentage (TS%) measures scoring efficiency across field goals and free throws. Composite indexes such as PER-style ratings mix scoring, rebounding, passing, and other box stats into a single number.
These stats are powerful for quick scanning, but they can be misused when context is ignored. High TS% may reflect selective shooting on low volume, while some composite indexes can over-reward high-usage scorers and under-value defenders, screeners, or off-ball movers.
- Mistake: assuming a higher TS% always means the better offensive player; volume, role, and shot difficulty matter.
- Mistake: valuing players only by composite indexes, leading to overpayment for box-score stars who weaken overall team structure.
- Mistake: ignoring that efficiency often drops when a player's role expands and defenses focus more attention on them.
- Myth: low-usage players with strong efficiency are automatically "too passive"; some are correctly optimized finishers, not creators.
- Myth: one all-in-one number can rank every player across positions and roles fairly without supporting context.
- Actionable takeaway: pair TS% or PER-style metrics with usage rate, role description, and lineup data before judging a player's value.
- Diagnostic threshold: large gaps between great efficiency metrics and poor on/off impact often signal that box-score stats are missing important context.
Noise, Regression to the Mean and Sample-Size Rules for Reliable Inference
Noise is the random variation in outcomes even when underlying skill is unchanged. Regression to the mean describes how extreme performances tend to move back toward a player's or team's typical level over time, especially when the initial sample is small.
Mini-case: imagine a team that starts the season hitting an unusually high rate of low-probability shots by xG. A basic regression-aware approach would be:
// Pseudocode for a simple regression check
if (current_rate is extreme AND attempts are relatively few) {
    expect performance to move toward long-term and league-average rates;
    avoid major strategic changes based solely on the hot streak;
}
By comparing current numbers to both historical performance and league baselines, you can separate true improvement from streaky shooting, unsustainably hot goalkeeper play, or unusual opponent slumps.
- Actionable takeaway: always compare current performance to both past seasons and league context before declaring a true breakout or collapse.
- Diagnostic threshold: any extreme performance based on a short run of games or attempts should be treated as uncertain until confirmed by a larger sample.
Fast Practical Tips for Using Advanced Team Metrics
- Start every review with per-possession or per-play numbers, then move to shot quality (xG) and impact metrics.
- Cross-check any surprising metric with video to understand the underlying behaviors, not just the outcome.
- Track a small dashboard: one chance-quality stat, one efficiency stat, one impact stat, and one lineup stat.
- Use your sports analytics platform for team performance metrics to automate routine reports so staff can focus on interpretation.
- Re-evaluate conclusions each time you double your sample size; be ready to adjust if early trends fade.
Quick Self-Check: Are You Reading Advanced Stats Correctly?
- Do you always convert per-game numbers into per-possession or per-play rates before comparing teams?
- Have you checked whether changes in results match changes in xG or other quality-based metrics, not just conversion rates?
- Are you combining impact and lineup stats with film to verify what the models think is driving performance?
- Do you routinely question extreme hot or cold streaks and look for regression toward long-term levels?
- Is your use of advanced football team stats analysis software and similar tools aligned with clear tactical and roster decisions?
Practical Clarifications, Common Misinterpretations and Quick Fixes
Is xG more important than actual goals when judging performance?
Actual goals decide games, but xG is usually better for understanding underlying process. Use goals for results, xG for diagnostics. When the two disagree over a short stretch, trust xG more for predicting what is likely to happen in the future.
How many games do I need before trusting a new efficiency or impact metric?
You need enough possessions or plays that a few lucky or unlucky events cannot dominate the sample. Use early numbers as hypotheses, not conclusions, and increase your confidence as the sample grows and stabilizes against historical norms.
Why do different advanced metrics sometimes disagree on the same player?
Each metric emphasizes different inputs and assumptions. For example, a player might grade well in box-score-based BPM but poorly in lineup-based impact if their stats come mostly in low-leverage minutes. Investigate the disagreement with film and role context.
Can I compare advanced stats across different leagues or levels?
You can, but only after adjusting for pace, style, and league averages. Treat raw values cautiously; instead, look at how far above or below league norms a player or team sits, and remember that talent distributions differ by level.
How should coaches integrate advanced stats into daily decision-making?
Use stats to frame questions, not to dictate answers. Build a small, consistent dashboard aligned with your game model, review it after each match or series, and discuss it with staff alongside video and player feedback before changing tactics or rotations.
Do I need expensive software to benefit from advanced metrics?

High-end tools can help, especially integrated soccer team performance analysis software with advanced metrics or an all-sport platform, but basic concepts like xG trends, per-possession efficiency, and simple on/off splits can be tracked with modest tools if your data is organized.
What is the biggest red flag when reading advanced stats?
The biggest warning sign is making major strategic decisions based on short-term, extreme numbers without context or regression checks. When in doubt, wait for more data, compare to league baselines, and verify with video before acting.